Zeppelin Metrics on the Datadog UI
Qubole Notebooks supports publishing zeppelin metrics to the Datadog UI.
Note
The feature to use the Datadog UI is not available by default. Create a ticket with Qubole Support to enable this feature on the QDS account.
When Datadog monitoring is configured on a spark cluster, the following Zeppelin metrics of an active cluster are published on the Datadog UI.
zeppelin.pendingJobs.total.numberzeppelin.driver.count.masterzeppelin.driver.memoryAllocatedMB.masterzeppelin.driver.memoryAllocatedPercentage.masterzeppelin.notebook.total.diskUsageMBzeppelin.notebook.total.number
As a prerequisite, you must enable Datadog monitoring on the cluster.
Enabling Datadog
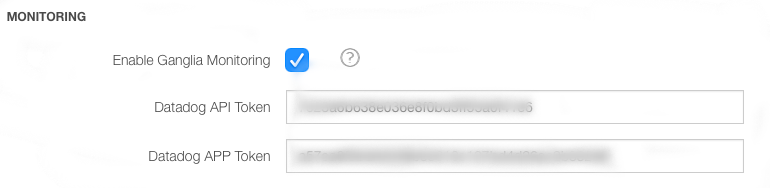
Advanced configuration: Modifying Cluster Monitoring Settings describes how to enable Datadog through the cluster UI. Add Datadog API and APP tokens in the Advanced Configuration of the cluster. Create a New Cluster describes how to configure Datadog through a API call.
Here is an example that illustrates Datadog tokens on the cluster UI.
You can enable Datadog monitoring in Control Panel > Account Settings which would apply the settings on all clusters of that account. For information on enabling Datadog at account level, see iam-keys or Managing Roles.
Viewing the Zeppelin Metrics on the Datadog UI
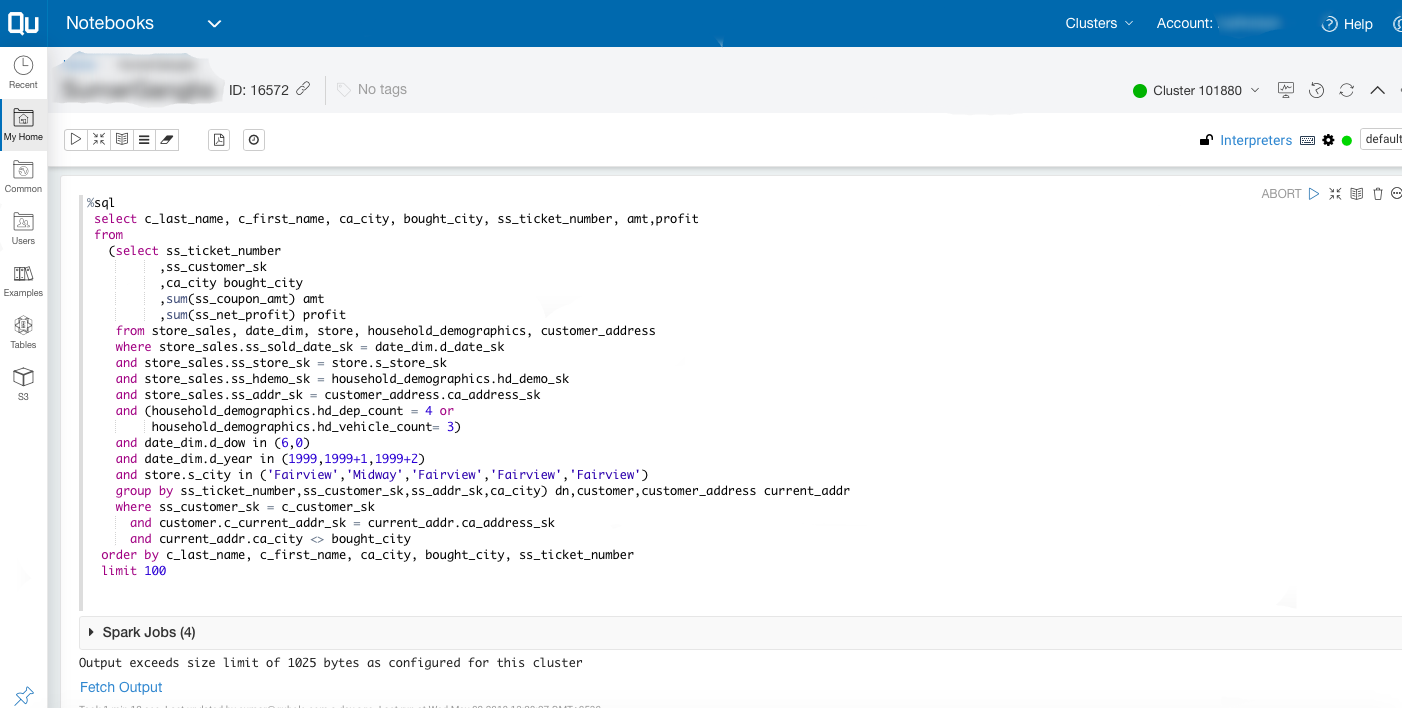
After enabling Datadog on the QDS account/cluster, the Datadog metrics related to the cluster are displayed on the Datadog UI. For example, run a Spark query on the QDS UI (or API).
Here is an example of a Spark query run from the Notebooks.
Note
Zeppelin metrics are not available on the default Datadog dashboard.
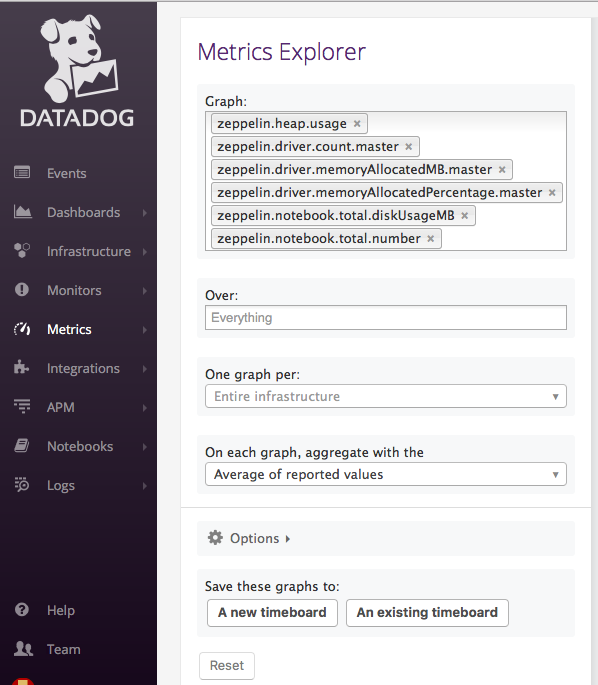
Log in to the Datadog UI.
Navigate to Metrics > Explorer on the left navigation pane.
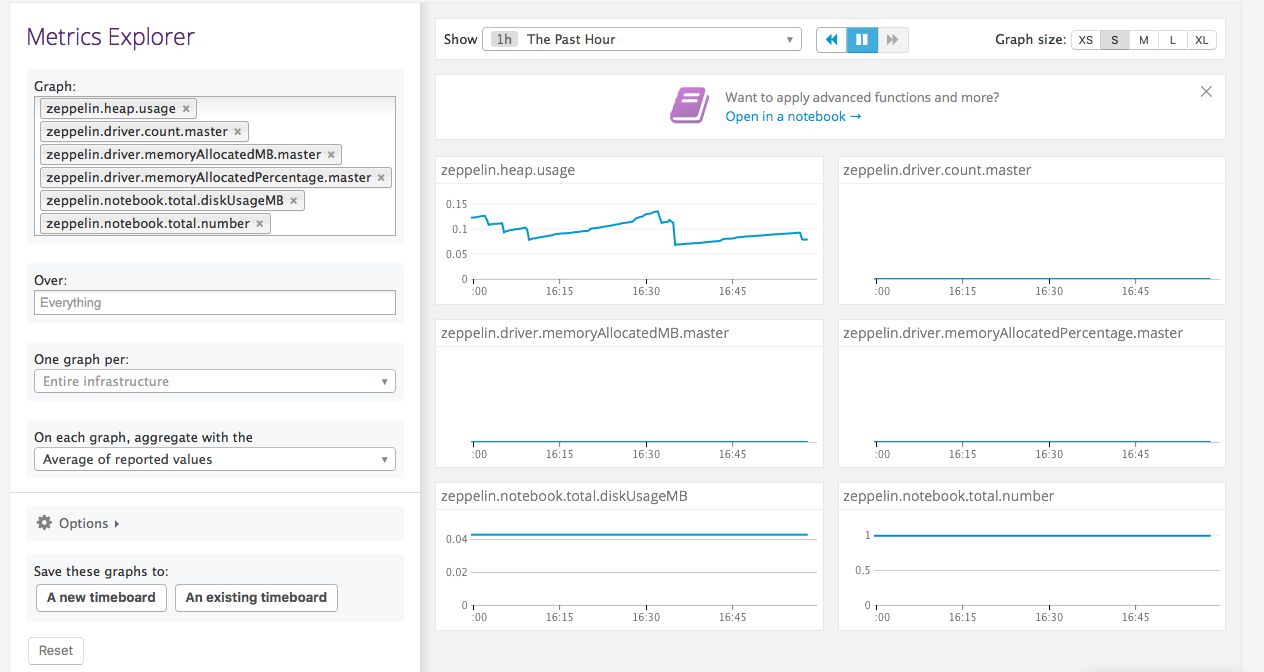
Enter name of the metrics in the Graph field to view the graphs as shown in the illustration below.
The graphs are displayed on the right pane of the Explorer page as shown in the illustration below.